Aerocene: Becoming Aerosolar
A collaboration between Tomás Saraceno, Visiting Artist MIT
Leila Kinney, MIT Center for Art, Science & Technology (CAST)
Lodovica Illari and Bill McKenna, MIT Department of Earth, Air and Planetary Sciences
Introduction
One of the oddest sensations of hot air balloon flight is the feeling of absolute stillness and extreme quiet. A paradox: moving with the wind eliminates the feeling of wind and thus a feeling of movement. Tomás Saraceno is fascinated by – or, more accurately, creatively obsessed by – airborne movement of all kinds, from the astonishing phenomenon of “kiting” spiders that create parachutes of gossamer silk, catch updrafts and drift through the jet stream to propel themselves hundreds of miles from land, to the ongoing series of prototypes for floating biospheres fueled by wind and solar power that he has created for more than fifteen years, Air-Port /Cloud-Cities. They are speculative models for alternate ways of living – and alternate ways of flying. Saraceno would like to propose zero-carbon emission flight; make your reservations now for Aerosolar Airlines, as he has been known to say!
As the inaugural Visiting Artist for MIT’s Center for Art, Science & Technology (CAST), beginning in Fall 2012, Saraceno brought these multifaceted interests into creative dialogue with multiple departments across the Institute. Moving among practical, theoretical and hypothetical considerations, Saraceno discussed everything from nanoengineered materials to solar energy to weather patterns to the origins of the universe, asking architects, engineers and scientists in diverse fields to imagine with him what a different reality might look like. A wide-ranging foray into disparate areas of expertise led Saraceno to develop a productive collaboration with Lodovica Illari, a climatologist whose specialty is large scale atmospheric dynamics, and Bill McKenna, whose architectural training led him to her EAPS (Earth, Atmospheric and Planetary Sciences) lab to work on visualizations of geophysical fluid dynamics. Sharing a mission “to make people understand what is not intuitive” (her words), they began with “Weather in a Tank,”[1] a series of rotating fluid laboratory experiments created by Illari and Professor John Marshall.
Aerocene is the latest node in Tomás Saraceno’s continuous experimentation with solar balloons, which include his own do-it-yourself versions, (e.g., 59 steps to be on air by sun power, 2003), crowd-sourced variations made with plastic shopping bags (Museo Aero Solar, ongoing since 2007,) and a residency at CNES (Centre Nationale d’Études Spatiales), spent immersed in studying their MIR (Montgolfière Infrarouge) solar balloon flights. Now Illari and McKenna have used the MIR flight data to visualize the possibilities for a new series of solar balloons that could monitor the chemical components of the stratosphere and measure their effect on climate change. But there is more than a gathering scientific data in the offing. In keeping with his capacity to work at multiple scales, modes of expression and registers of engagement, Saraceno also sees these balloons as “lighter-than-air sculptures” and as an opportunity for a highly distributed network of participants to monitor their progress, predict the weather collectively, and raise awareness of our technological disruptions of planet Earth. The scenarios outlined below link technical expertise to visionary thinking and material realities to a future “jet stream art research center” – “Cloud Cities” in the making.
An example from the past
Montgolfiere InfraRouge (MIR)
Tomás Saraceno is a visionary artist who is constantly pushing the boundaries of our imagination. He has been fascinated by clouds and lighter-than-air balloons for many years – see his Cloud City exhibition [2]. Recently he has fallen in love with infrared/solar balloon technology which he has dubbed ‘aerosolar’; a balloon with zero energy consumption that can fly using radiation from the sun during the day and radiation from earth during the night. This technology, originally developed by CNES (the Centre National d’Etudes Spatiales) [3] in the 1970’s, can be used as an inspiration, Saraceno believes, for how mankind could begin to live in symbiosis with the earth, sparking the imagination and inspiring the public think about conservation at a time when the earth is at risk from overpopulation and climate change.
The aerosolar balloon is ‘zero-energy’ and yet can circumnavigate the globe much like the albatross of the southern oceans, but flying much higher, even up in to the stratosphere. One could imagine using such balloons to monitor the ozone and other chemicals in the troposphere and stratosphere with nearly zero energy cost – except for the helium or hot air needed to lift the balloon in to its initial orbit.
In collaboration with Saraceno, our group at MIT has studied the data from past balloon flights carried out by CNES, and begun planning future flights of smaller balloons that are being developed with Saraceno and his group.
Since 1971 CNES has been supporting a program of long-duration scientific flights using hot air balloons, MIR (Montgolfiere InfraRouge). The MIR is a very light hot-air balloon, which is heated by direct and reflected solar fluxes during the day and upwelling infrared fluxes from the Earth at night (see Fig1).

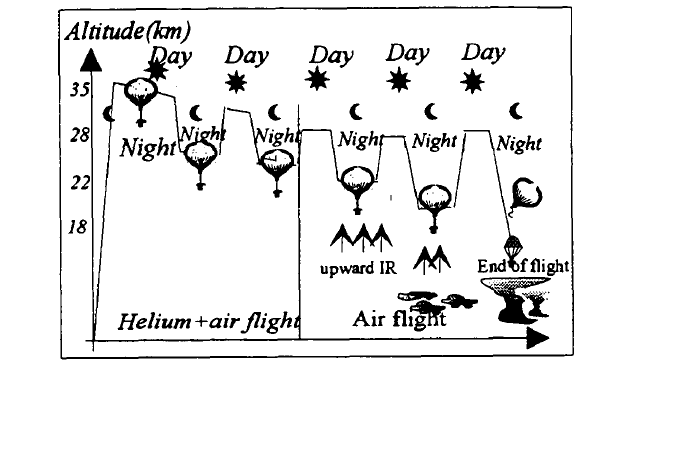
Fig.1 MIR radiative budget (left), MIR flight profile (right)
Letrenne et al (1999): French Long Duration Balloon Activity: The InfraredMontgolfiere (MIR), Proceedings AIAA International Balloon Technology Conference, 28 June – 1 July, 1999, Norfolk, VA.
Fig.1 (left) shows the MIR radiative budget. The balloon is heated by upwelling infrared fluxes from the earth during night–time and direct and reflected solar fluxes during day-time. The first ascent from the ground is made possible using helium gas. After 2 or 3 days the helium is completely evacuated and the MIR then flies only using hot air –see Fig.1 (right).
The MIR balloons have been used to perform tropical and trans-polar stratospheric flights. As an example we describe a flight in 2004, when the balloon travelled from Brazil to Australia rising and falling in the stratosphere over the diurnal cycle, whilst being carried along by the prevailing winds.
MIR flight from Brazil to Australia (February, 2004)
As shown in Fig.2 and 3, the balloon cycles up and down in the stratosphere following the sun’s diurnal cycle, as it is carried by the winds from Brazil to Australia. During the day it rises and it sinks at night.
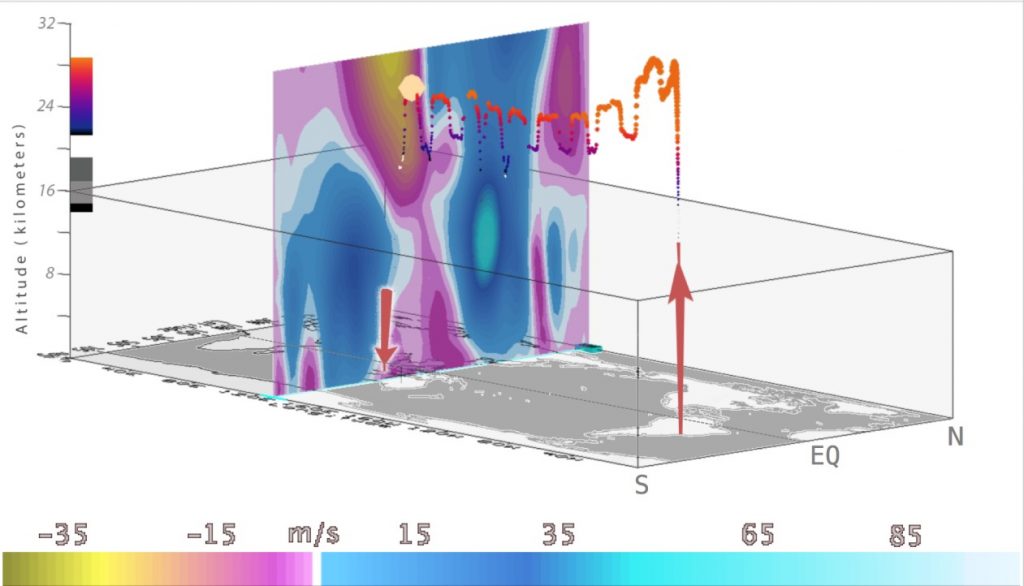
Fig 2: The path of the solar balloon between February 2nd to 14th 2004 as it flies from Brazil to Australia. Colors along the track represent the altitude of the balloon: orange/red = high altitude, purple/blue = low altitude.
Also shown is a meridional (S-N) section of the zonal-average zonal wind (flow from the west is in cyan/blue and flow from the east in pink/gold). Following the flow from the east, typical of the tropical lower stratosphere at this time of the year, the balloon moves up and down between the heights of 30 km at day and 20 km at night.
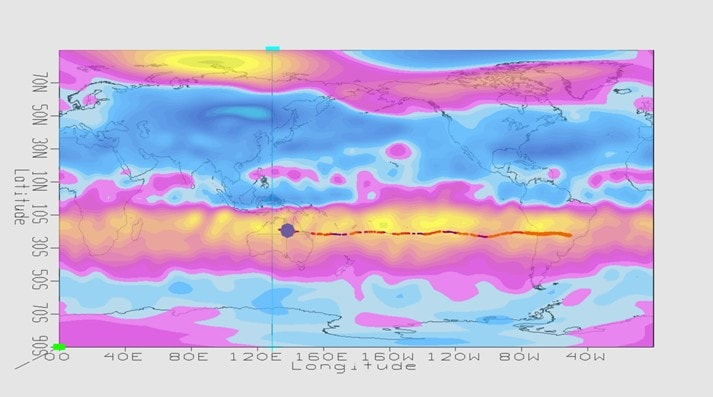
Fig 3: Map of the zonal wind at 30 mb on Feb 14, 2004. The balloon can be seen to be drifting from east to west, following the prevailing tropical flow in the southern hemisphere: blue indicates a wind from the west to east, pink and yellow from the east to west.
Trajectories for February 2004
Using NCEP reanalysis data from February 2004, MIR virtual flight trajectories have been computed beginning from lots of initial launch points over all of S. America. Most of the trajectories reveal a flow from east to west over the central Pacific. These are the winds that the actual balloon was embedded in, as can be seen from the balloon track on the left of Fig. 4.
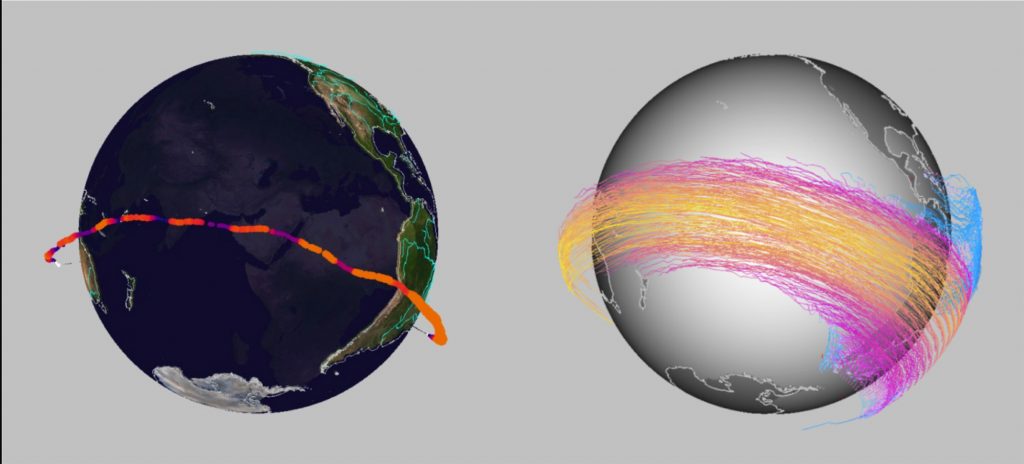
Fig. 4 (left) – Observed path of the balloon from February 2nd to 14th 2004, as it flies from Brazil to Australia – daytime is marked orange, nighttime is marked violet.
(right) 30 mb trajectories in February 2004 (10 days travel) at the same time as the MIR flight. Trajectories are colored with the direction of the wind: blue from the west to east, pink and yellow from the east to west, as in Fig.2. Initial launch positions for the trajectories are over South America.
MIR flight and ozone (February, 2004)
The MIR balloon could be a great tool to monitor the ozone distribution in the stratosphere if it were instrumented with an appropriate measuring devise. The following images show the track of the 2004 balloon flight together with the observed ozone distribution at that time. In Fig.4 we see it sampling high ozone concentration in the stratosphere along the equator. See Marshall et al. (below, under References 2) for the impact of the ozone on climate.
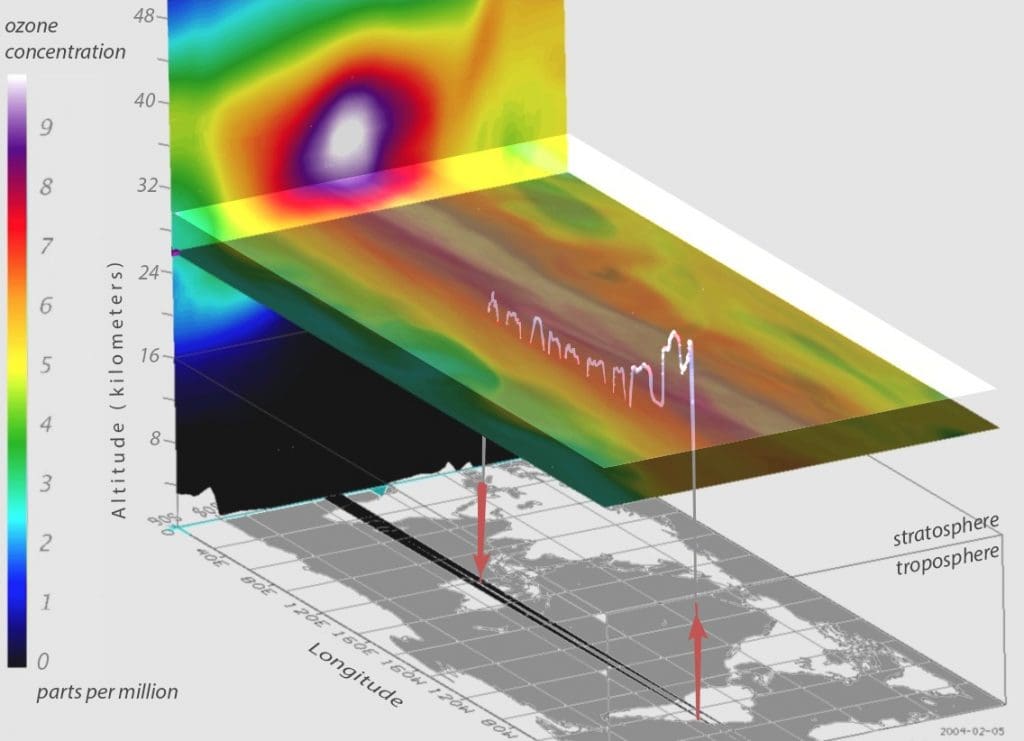
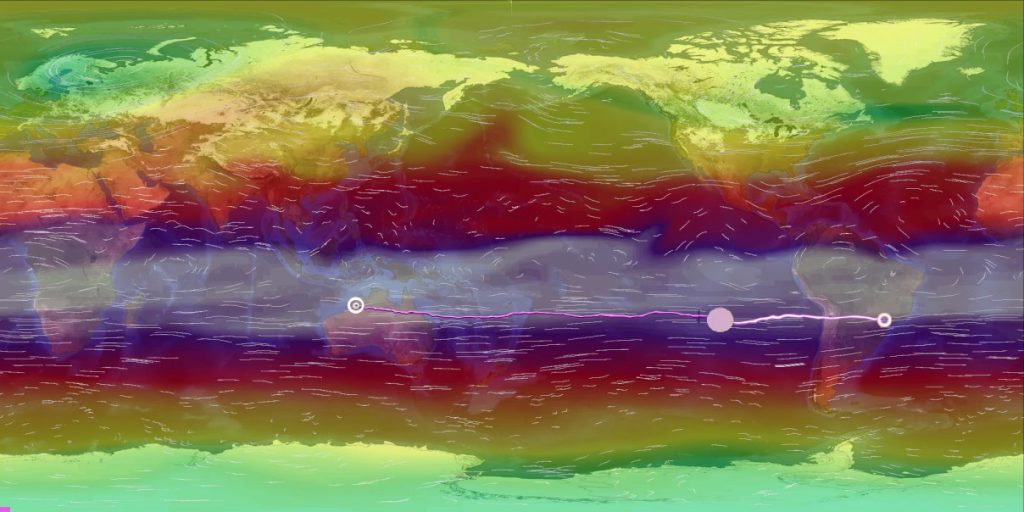
Fig. 5 (top) Section is showing vertical distribution of ozone during the flight period – purple/white indicates high ozone concentrations. Ozone has a minimum concentration in the troposphere and a maximum in the tropical lower stratosphere at a height of around 30km. (bottom) During the day the balloon flies just below the region of maximum ozone concentration, moving from east to west, as seen in Fig 3.
The CNES explored conditions during the year when it was best to fly a hot air balloon.
The period of the flight was carefully chosen to maximize solar and infrared radiation thus prolonging the duration of the flight, as shown in Fig.6.
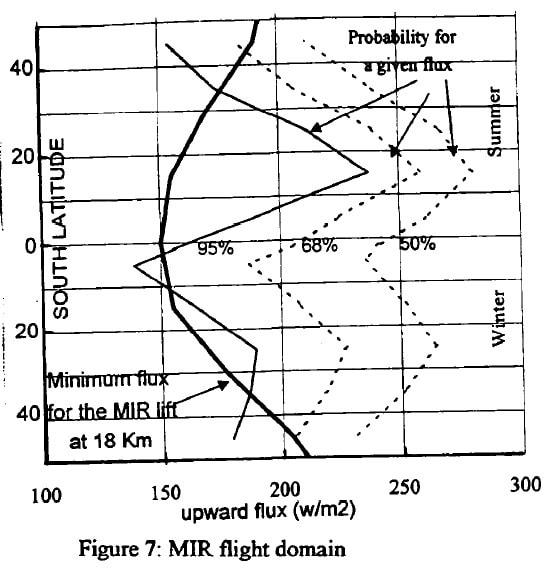
Fig. 6 A statistical analysis of upward IR fluxes from SCARAB satellite during 5 years (1994-1999) compared to the computed IR flux curve sufficient to stabilize the MIR at low level for the season and latitude given.
Fig.6 shows that the least favorable conditions are encountered primarily in the middle and higher latitudes, due to the combined occurrence of dense cloud formation in the troposphere at these latitudes and relatively high temperature in the lower stratosphere. Clouds act to shield the balloon from upwelling infrared radiation resulting in the air temperature inside the balloon falling during the night, and reducing the necessary buoyancy needed to keep it afloat. The most favorable period and ideal latitudinal zone is found 25 degrees in Austral summer and 15 in Austral winter. It is for this reason that CNES chose to launch the balloon in February at the latitude of 25S.
Looking to the future
When and where would it be best to launch a balloon? How do we choose?
To get a better idea it is important to check the climatological distribution of the wind throughout the year. Fig.7 shows isosurfaces of the zonal wind in January (left) and July (right): inside this surface the wind speed is greater than 25 m/s. It is clear that in the Northern hemisphere flow tends to be strong and mostly toward the east in winter. A band of flow from east to west tends to dominate the tropical atmosphere, but its location shifts with the seasons as the Hadley Cell migrates.
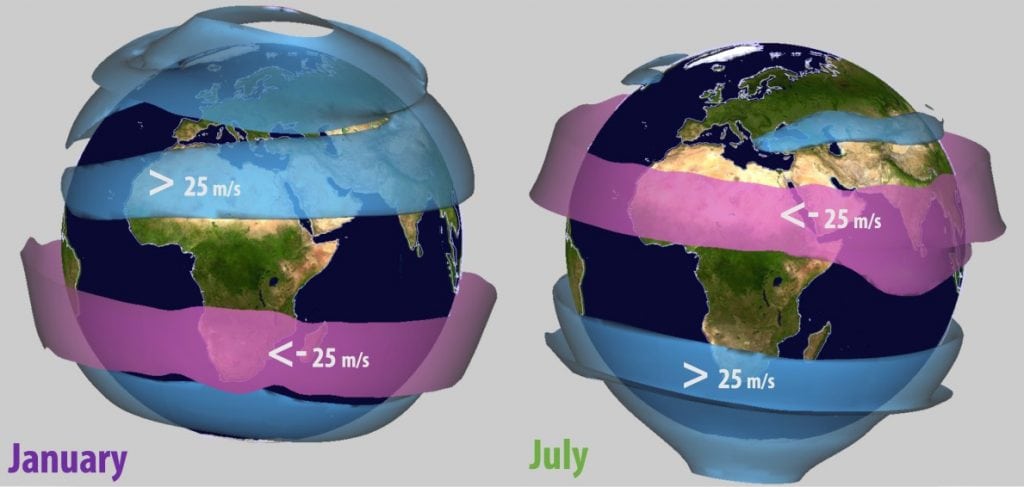
Fig. 7 (top) Isosurface ofwind speed (u >25 m/s) during January, showing a prevalent flow from west to east (blue) in the northern hemisphere, while flow is from the east to west (pink) (u <-25 m/s) in the southern hemisphere. (bottom) ) as above but for July, showing that at this time of the year the flow from the east is strong close to the equator, while in the southern hemisphere the flow tends to be from the west (NCEP Climatology).
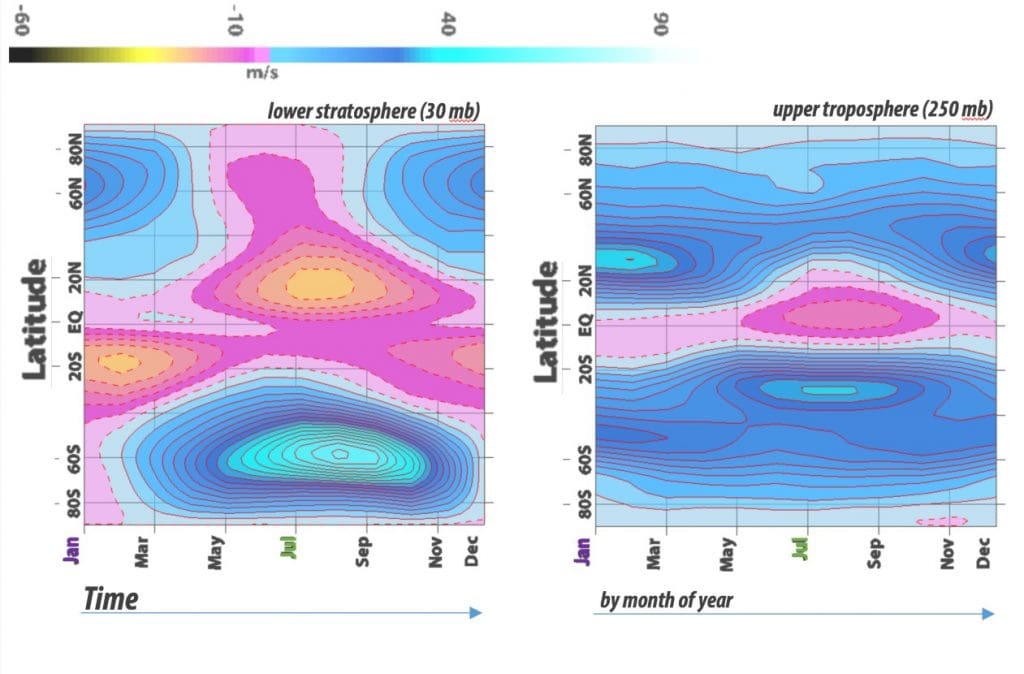
Fig. 8 Hovmoller diagram of the zonal wind as a function of time – months of the year. Flow from west to east is marked in cyan/blue, flow from east to west is marked in pink/orange. (left) flow in thestratosphere at 30 mb and (right) flow in thetroposphere at 250mb.
Hovmoller diagrams at various pressure levels, as in Fig.8, can help us choose the appropriate time of the year to launch a balloon along specific tracks. If we want to fly a balloon from Brazil to Australia in the stratosphere, we should choose a month such as January or February. In fact several MIR flights in the tropical stratosphere were launched from Brazil or Ecuador in February (Fig. 2).
Similarly let’s suppose we want to fly a balloon from Boston to Paris: when would a launch lead to the fastest travel time? We find that it is also best to launch in January or February, when the flow from west to east at the jet level (250 mb) is very strong, as can be seen in Fig.8 (right).
Trajectories from current forecast data for the stratosphere
Ifwe were planning to launch a balloon in to [AA1] the stratosphere from South America now, in October 2015, as we write this article, where might it be carried by the prevailing winds? We can use the NCEP global model (GFS) forecast data[5] to figure this out.
Fig.9 shows typical trajectories at 30 mb starting from different locations over South America. It is clear a track from east to west is dominant at low latitudes, whereas at high latitudes and close to the equator it is from west to east.
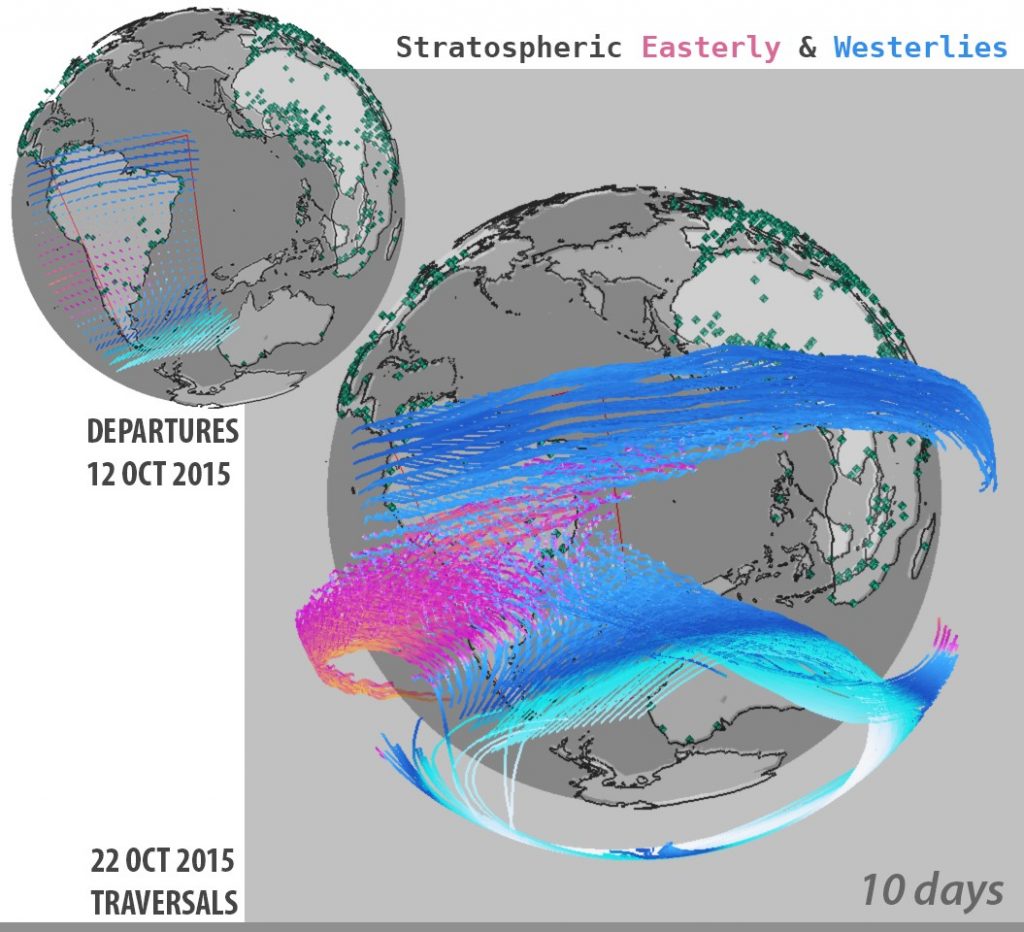
Fig. 9 Trajectories at 30mb in October 2015. They show 10 days travel, starting from grid point locations over South America – see upper corner map for initial locations. Trajectories are computed using the GFS forecast data (GFS model run from October 12th, 2015) – cyan/blue = flow from the west, pink/orange = flow from the east.
Trajectories from forecast data in the troposhere – for Paris
What about launching a balloon in the troposphere at the jet level to try to reach Paris from the US at this time of year (October)? Where would it likely go?
To estimate where we might launch the balloon, we have computed backward trajectory for 5 days starting at locations near Paris in western Europe – see Fig.10.
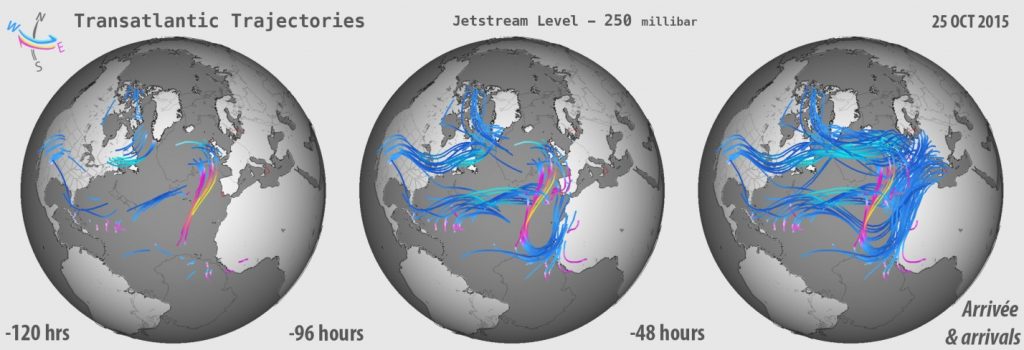
Fig. 10 Trajectories at 250 mb in October 2015 (October 20, 2015). Left imageshows travel aftter 1day, centerafter3 days, right after 5 days. Flow from the west is marked in cyan/blue, flow from the east is marked in pink/orange. Backward trajectories have been computed using forecast data (GFS model) from locations over western Europe.
In October the flow is typically not very zonal, and therefore, it is not surprising that we might reach Paris in 5 days starting from very different locations over the US, for example, Texas, the East Coast or even the Caribbean Islands.
Summary
Tomás Saraceno’s vision of flying solar balloons between cities might be too futuristic, but this technology could be used to sense the lower stratosphere at zero energy cost, although some helium might be used at the launch time. The lower stratosphere is a critical layer where the chemistry of ozone, methane and other chemicals has a fundamental impact on our climate. Concentrations of these chemicals are not well known and there is a clear need to better monitor these constituents.
To summarize our view into the future, we have computed trajectories at two levels, 30 mb and 300 mb, starting from all world airports – Fig11.
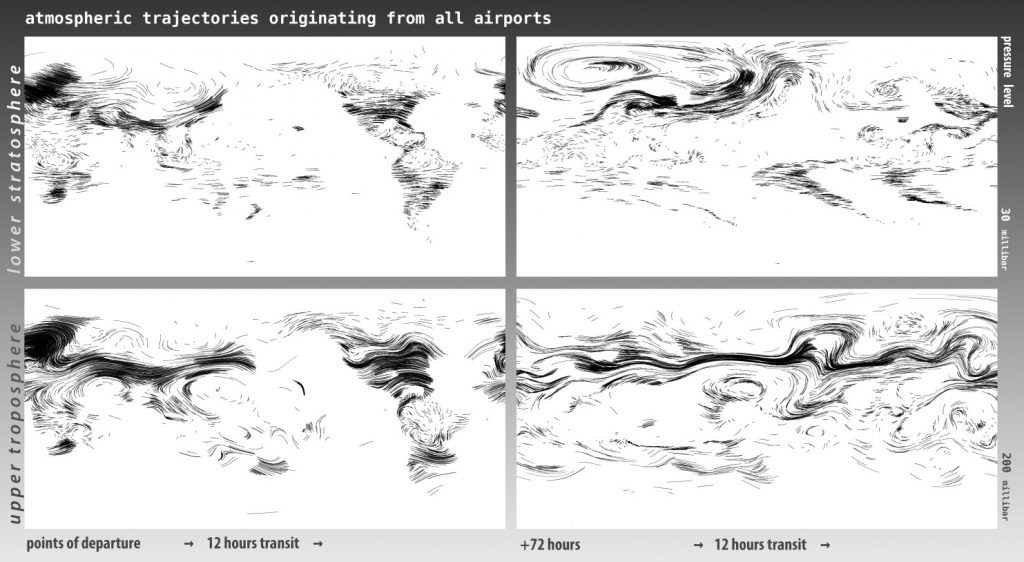
Fig. 11 Horizontal trajectories at two levels and at two time periods. Trajectories are seeded from all world airports. One single path shows travel time of 12 hours, snapshots are 6 days apart. (Integration begins on February 4th, 2004). Top panel: trajectories at 30 mb. Bottom panel: trajectories at 200 mb. (Trajectory calculations by Prof. Glenn Flierl, MIT [6])
It is evident from Fig.11 that at 30 mb, in the lower troposphere, after 6 days of travel, the balloons would have sampled most of the continental area over the earth, but with gaps over the ocean. On the other hand, because the balloons need IR radiation at night, there are only limited regions on the earth where the balloons can stay up for a long period – see Fig.6 – these are mainly the regions of sinking of the Hadley cell where there are no clouds. This is a big limitation at the moment but we feel that it is worth revisiting the possibilities of flying some solar balloons again to measure the stratosphere more accurately than has been done in the past.
The IR/solar balloons could be the answer. With their low energy consumption they are the best example of green technology for atmospheric sensing!
Note: Integrated Data Viewer4 (Unidata) [7] was used for most of the plots.
Acknowledgements
Lodovica Illari acknowledges support from the Frontiers in Earth Science Dynamics (FESD) ‘Ozone and Climate Project’ of the National Science Foundation (US).
Bill McKenna acknowledges support from MIT Center for Art, Science & Technology (CAST) and Prof. Glenn Flierl (EAPS). Tomás Saraceno has been a Visiting Artist with CAST since 2012.
References
(1) CNES (MIR)
[1] Montgolfiere InfraRouge: https://cnes.fr/fr/web/CNES-fr/9276-mir-principes-du-vehicule.php
Letrenne, et al. (1999): French Long Duration Balloon Activity: The Infrared Montgolfiere (MIR), Proceedings AIAA International Balloon Technology Conference, 28 June – 1 July, 1999, Norfolk, VA.
(2) MIT (EAPS)
John Marshall, Susan Solomon, Lodovica Illari. Frontiers in Earth System Dynamics: NSF-funded project on the climate implications of the ozone hole: : http://ozoneandclimate.squarespace.com/
(3) NCEP (Global Forecast System)
GFS: http://www.emc.ncep.noaa.gov/
(4) UCAR (Unidata)
Integrated Data Viewer (IDV): http://www.unidata.ucar.edu/software/idv/